(2021)
Abstract
Nowadays, cryptocurrencies are being considered as an additional asset to the investor. To diversify the portfolio, adding newly uncorrelated, negatively correlated holdings into a portfolio
is ideal. However, since cryptocurrencies are very new to people and hard to understand, most of the investor does not know how cryptocurrency interact with other assets, some say that
cryptocurrency is considered as an alternative investment, therefore, should not correlate with our dollar, some say that cryptocurrency is being direct substituted with gold as an alternative
asset. Therefore, to acknowledge the role of cryptocurrencies in portfolio diversification, we conduct the asset return regression and principal component analysis. Once investors know the
position and interaction of cryptocurrency with another asset, an investor can see the role of the asset and can design derivative strategy or add derivatives into diversified portfolios. The
analysis uses Bitcoin and Ethereum as cryptocurrencies since they consider the top 2 cryptos by market capitalization. The research methodology will be conducted as followed, define the
Bitcoin / Ethereum definition, preliminary analysis, methodology, regression analysis, principal component analysis, derivative application, and summary.
Definition
Bitcoin vs Ethereum vs Tether
Tether is the stable coin. [This has the highest market capitalization among any stable coin] this type of cryptocurrency being considered the core cryptocurrency for investors. One of the essential functions of the tether is hedging cryptocurrency against another highly volatile cryptocurrency. Stable coins are the type of blockchain that pegged the value with actual
commodity; this hep the stable coin to be less volatile than the nonstable coin. The value of 1 USDT can be exchanged with 1 USD.
Ethereum is the platform that has ETHER in.
Ethereum is a decentralized platform and programming language based on their cryptocurrency called ETHER. Ethereum provides the developer to write the smart contract and build the decentralized applications on top of the platform. At the same time, bitcoin provides the anonymous transfer value from 1 individual to another individual. Ethereum provides better way
to do other things, describe as following:
1. Digital Currency, we can have Ether as digital currency.
2. Ethereum platform provide the operation of smart contract writing of Ethereum.
Bitcoin is the peer-to-peer online cash that is decentralized, does not need a centralized operation. The primary purpose of bitcoin is the be an alternative asset to the actual currency, for instance, USD.
Summary of difference
BITCOIN: BTC primary purpose is the alternative currency without centralized operation
ETHERUEM: ETH primary purpose is to be platform for developer to build and write smart contract/app.
TETHER: USDT primary purpose is to be stable coin that pegged with 1 USDT = 1 US Dollar
Facts &Hypothesis
The project shows that these cryptocurrencies play a huge role and have their primary purpose. However, we do not know how these cryptocurrencies interacted with another asset in terms of investment perspective. Therefore, we are setting up the hypothesis as follows:
Hypothesis
1. These Cryptocurrencies should be alternative asset to stock market.
2. These Cryptocurrencies should be alternative asset to alternative investment.
3. These Cryptocurrencies should be alternative to each other [ If their underlying were not the same]
The project will answer these hypotheses based on data analysis with a regression/principal component analysis model. So that we will know the actual role of the crypto derivative, what the appropriate futures options are, and how we could pick these instruments for the diversified portfolio. The cryptocurrencies that we will analyze are Bitcoin and Ethereum. Since tether only pegged their value with our dollar, most of the time Tether value will = 1$. Therefore, we will not use the Tether for asset return analysis.
Market share of these Cryptocurrency
Bitcoin originated the term cryptocurrency in 2009. The market has grown so much in value. The cryptocurrency market also grows in variety, accounting for more than 5,000 cryptocurrencies now in the market. In this project, we pick up only the large one for analysis, BTC/ETH.
The cryptocurrency is appealing recently due to the high yield comparing to the other asset. The figure shows the annualized return of assets from 2016-2021. The high return and technology were appealing for the tech investment. However, the volatility and downfall of these cryptocurrencies are substantial High-risk, High reward investments. The riskiness raises the
question to the newly attended investor, “Will Crypto price go further?” one may say that they are expensive; one may say this is just the beginning. As the objective of the paper, prediction is challenging and not accurate. Therefore, the report will try to understand their characteristic of cryptocurrency, how they respond to another asset. Thus, the investor can decide the investment strategy/portfolio diversification and develop derivatives to meet the investor.
Dataset
31.41% -20.75%
The data we used for analysis we can divided into 3 categories, as below:
1. Stock indices: the market stock index of major country.
3.52%
2. Alternative asset: the asset price/yield that provided as alternative for diversification.
3. Cryptocurrency: The cryptocurrency price per 1 USD.
1.Stock Indices consisted of
1.1 DOW as DOW 30 index, representing United Stated stock market.
1.2 SP500 as S&P500 index , representing United Stated market.
1.3 FTSE100 as FTSE100 index, representing United Kingdom stock market.
1.4 SPASX200 as S&P/ASX 200 index, representing Australia stock market.
1.5 SPTSX as S&P/TSX index, representing Canada stock market.
1.6 CAC40 as CAC 40 index, representing France stock market.
1.7 DAX as DAX index, representing Germany stock market.
1.8 HS as Hang Seng index, representing Hong Kong stock market.
1.9 NFTY as Nifty 50index, representing India stock market.
1.10 NIKKEI as Nikkei 225 index, representing Japan stock market.
1.11 KOSPI as KOSPI index, representing South Korea stock market.
1.12 SMI as SMI index, representing Switzerland stock market.
1.13 SET as SET index, representing Thailand stock market.
2.Alternative asset consist of
2.1 GOLD as Gold commodity.
2.2 OIL as Oil commodity.
2.3 U.S. 10Y as 10-year yield bond at us commodity.
2.4 U.S. 2Y as 2-year yield bond at us commodity.
2.5 U.S. 3M as 3-month yield bond at us commodity.
2.6 DXY as US-Dollar index.
3.Cryptocurrency asset consist of
3.1 BTC as BITCOIN price per USD as denominator.
3.2 ETH as ETHEREUM price per USD as denominator.
3.3 USDT as TETHER price per USD as denominator.
The data ranging from 2017 Q2 – 2021Q1: approximation of 4-year return data. The analysis will be in weekly and monthly return. (log return) from 1 week (month) to the other week
(month).
Preliminary analysis
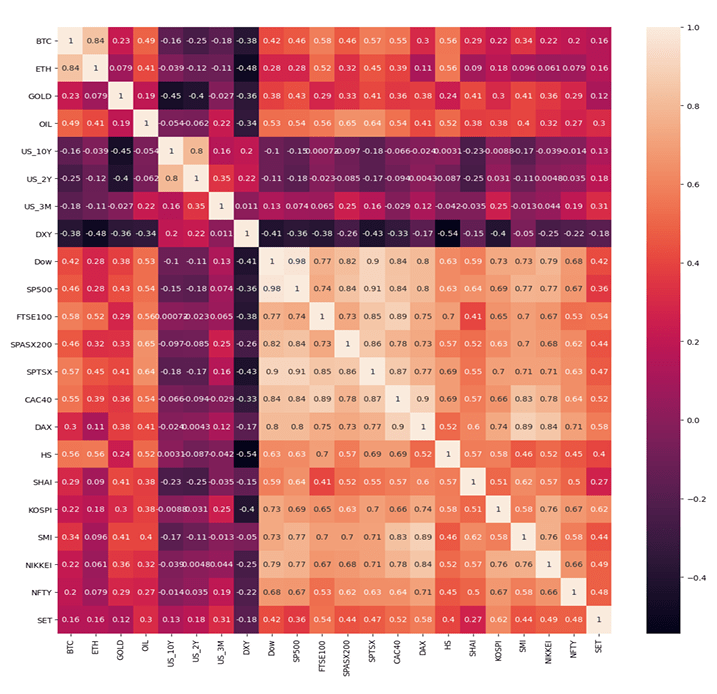
One of the essential things for a diversified portfolio is the asset covariate. If they are moving together in the same direction, then the portfolios are not well diversified. We investigate the correlation of BITCOIN / ETH among the various asset, stock indices, various country, bond yield, Gold, Oil, and Dollar index. The figure below shows the weekly and monthly correlation
of the asset return. Note that these variables are time-series variables. To prevent the nonstationary problem, the research transforms the price data by taking log (to prevent nonstationary variance) and taking 1st different (to avoid nonstationary mean).
Correlation (WEEKLY)
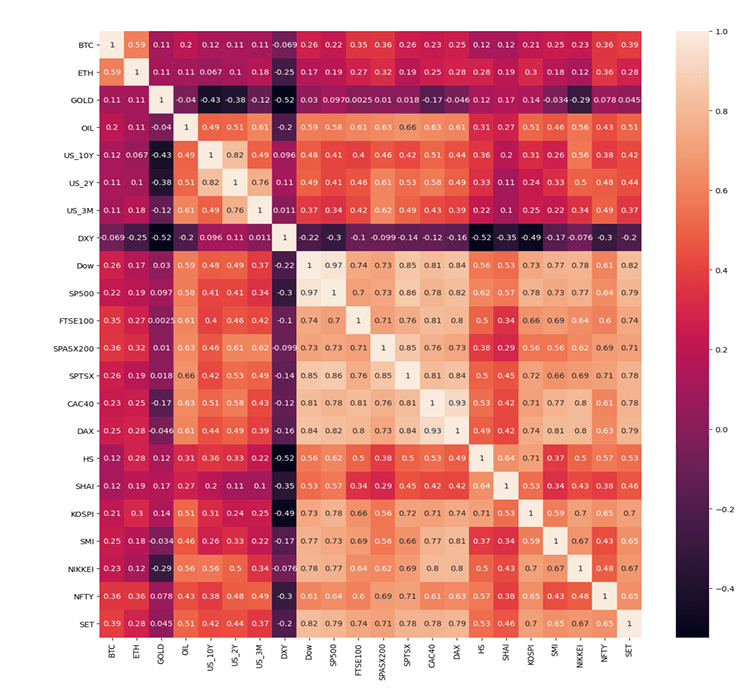
Correlation (MONTHLY)
Correlation Description
The BTC (Bitcoin return) for weekly correlation return is highly correlated with ETH (Ethereum return) around 84%. The same structure was applied for monthly correlation as well, with a lower magnitude of 59%. The cryptos also have a moderate correlation with stocks market return, with 40% of the weekly chart and 30% monthly chart. The alternative asset such as bond
yield/ Gold does not significantly correlate with the BTC and ETH. Therefore, these assets may not represent a substitute to the cryptos.
Above is the first glance analysis from both timeframes; BTC and ETH are moving in the same direction. The BTC/ETH have a typical correlation with the stocks market and an exceptionally low correlation with alternative assets. The paper will investigate more profound the BTC/ETH
standings comparing to other investments.
Note that we did not include the data for USDT (Tether) since the Tether is pegged with US dollars. Their value mostly = 1 US Dollar. Some noises make them deviated from 1 US dollar, but most of the time, their value will stay around 1 US Dollar.
Methodology
To know when to include the Cryptos into our portfolio, we need to understand the return
dynamics with other assets. We construct the methodology described below to answer the
following:
Hypothesis
1. These Cryptocurrencies should be alternative asset to stock market.
2. These Cryptocurrencies should be alternative asset to alternative investment.
3. These Cryptocurrencies should be alternative to each other [ If their underlying were not
the same]
Methodology 1: Regression analysis for two timeframes; currently, we have only data for 2017Q2 – 2021Q1. Therefore, the timeframe will have only two timeframes, weekly and monthly. The regression will conduct on both a daily and weekly timeframe. The regression methodology is as followed:
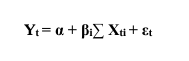
Where: Yt is the return of Cryptos (Either BTC or ETH) on weekly/monthly timeframe Xti are the return of each asset that will be analyzed.
Then we will analyze the βi relationship from cryptos to asset that we interested. The regression structure will be as following.
1.1 Cryptos against 1st glance, explanatory variable including DOW, GOLD, DXY. Each variable has its assumption in them; DOW is to find how Cryptos related to stock market Dow Jones, Gold is to find How crypto related to Gold is the substitute? And DXY is to find the relationship between dollar currency and cryptocurrency.
1.2 Cryptos against Stock market including DOW, S&P500, FTSE100, S&P/ASX 200 , S&P/TSX ,CAC , DAX ,Hang Seng , Nifty 50, Nikkei 225 ,KOSPI , SMI index, SET index,
1.3 Cryptos against alternative asset including: Gold commodity, Oil commodity,10-year yield
US Bond, 2-year yield bond U.S, 3M as 3-month yield bond.
1.4 Cryptos against crypto asset: BTC vs ETH.
At each regression model, we investigate the coefficient of each factor, including sign and coefficient relationships across the timeframe. We will pick up some of the critical factors and answer to hypothesis describe above accordingly.
Methodology 2: PCA on crypto dynamics and another asset. The research will conduct the principal component analysis on the interest variable. On each two main components axis, we will investigate the direction of cryptos and asset return movement, explore the variance movement that they are moving together or not; if yes, then those assets are not diversified.
Analysis
- Basic Assets
1st we look at regression analysis for cryptos and primary asset type, which consisted of DOW: dow jones stock index, GOLD: gold commodity, DXY: US dollar index. To identify the fundamental relationship between assets and cryptos, below show the regression analysis of weekly followed by monthly. The coef is the beta coefficient of each variable, Se is the standard error of beta coefficient of each variable, t is the student t-test of the beta of each variable with the hypothesis of their beta = 0, and p-value is the value for the t-test respectively. Each of the significant variables will be indicated by a 90% level of significance or p-value < 0.1. The red color indicates a meaningful negative relationship, and the green color showed a significant
positive relationship.
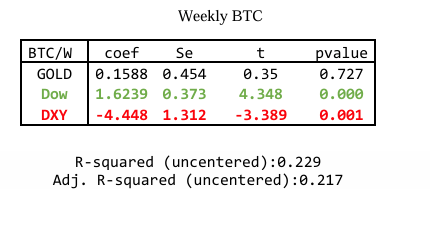
The significance describe below will indicate the 90% level of significance (or p-value < 0.1)
From 4 of the table above, weekly/monthly for BTC/ETH as Y variable, we can see that from 3 of the table above has DOW JONE significant positive impact on the cryptos return (Bitcoin and Ethereum) in the weekly timeframe. The same conclusion could be concluded from the monthly
data frame with a positive relationship and significant relationship on BTC. The ETH monthly on DOW is not substantial, but it has a positive relationship as well.
In the weekly timeframe, both DXY: dollar index is negative significant for BTC and ETH. The Monthly timeframe does not have statistically significant DXY to the cryptos returns.
In summary, the Dow Jone moves together with both cryptos in the same direction. The DXY has moved in a different direction as cryptos return in the weekly timeframe. The substitution effect occurs in only a week timeframe.
2. Stock Market Index
In the case of a stock market index, every stock almost has a high correlation to each other. By putting them, all into the model at once will generate a multicollinearity/ overfitting problem.
Therefore, for both timeframe and both crypto, we conduct principal component analysis. We choose 3 components, total cumulative variance of more than 80%: [0.70114267,0.06525144,0.0549119]. The three principal component variables will be selected into the regression model.
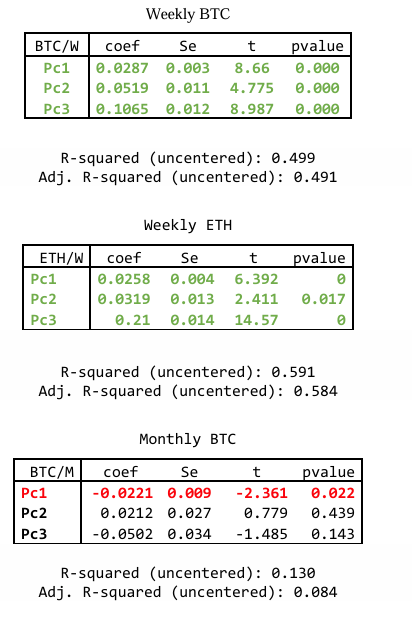

From the result above
Both Weekly crypto has all significant positive relationship with all principal components. However, the monthly table, give almost opposite direction with stock variables. The result is conflict which each other and conflict with the 1st glance analysis. To conclude the analysis, we will create the principal component against stocks further in “Part2 principal component
analysis.”
3. Alternative Asset
For the alternative asset regression analysis, we investigate the following asset, 1. DXY: US dollar index, 2. GOLD: gold commodity, 3.OIL: crude oil WTI, 4. US_10Y: 10 year yield us bond, 5. US_2Y: 2 year yield us bond, 6. US_3M: 3 months yield us bond. Each of the significant variable will be indicated by 90% level of significant, or p value < 0.1. The red color indicates significant negative relationship and green color indicated significant positive relationship.

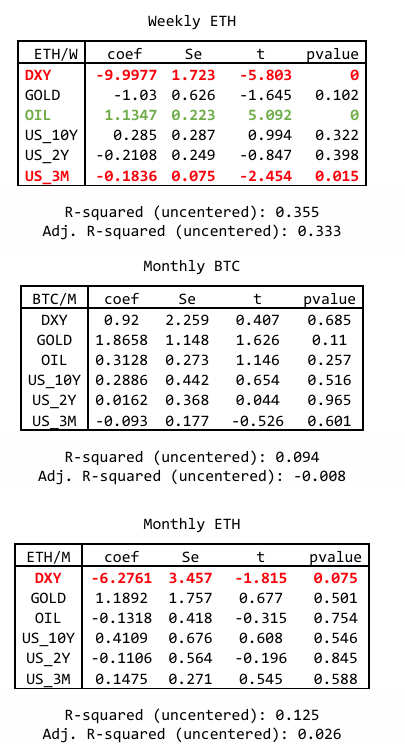
In the analysis above, 3 of the table (Weekly BTC, Weekly ETH, monthly ETH) indicates a negative relationship with DXY: us dollar index. An interesting fact is that the Cryptos here is not a direct substitution to the Gold with 4 of the table here showing the different sign, magnitude, and level of significance indicate the no substitution effect in a short timeframe and
longtime frame between cryptos and Gold, unlike the most well-known theory out there.
3-month yield in the negative direction in a short timeframe. It seems like the 3-month yield us bond behaves the same as the US dollar index. The 3-month bond is an indicator of high liquidity US assets. Therefore, in the short term, it makes sense that the yield of a 3-month bond in the US
has the same sign as DXY or us dollar index.
Other interesting facts are that in a short timeframe for both Bitcoin and Ethereum. The oil variable positively contributes to the cryptos returns; both have a 99% level of significance or p value < 0.01. Note that the monthly table does not significantly contribute to the cryptos’ oil
variable; therefore, this effect is only prevalent in a smaller timeframe.
4. Cryptos
For cryptos, we investigate the relationship between BTC: bitcoin and ETH: Ethereum. We did not include the USDT: Tether since this cryptocurrency has its value mainly = one USD. We retain the lag of 1 and 4 weeks for the weekly table and include lag of 1 and 2 months for the monthly table. Each of the significant variables will be indicated by a 90% level of significance
or p-value < 0.1. The red color indicates a significant negative relationship, and the green color showed a significant positive relationship.
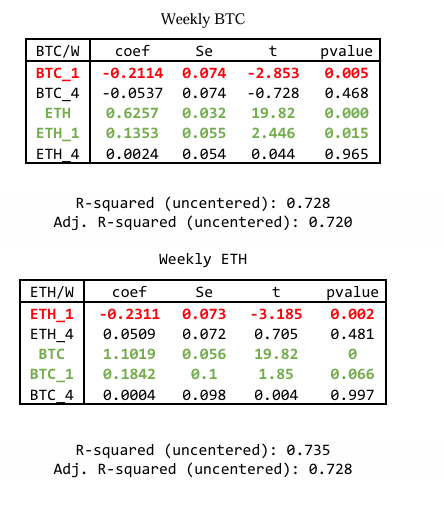
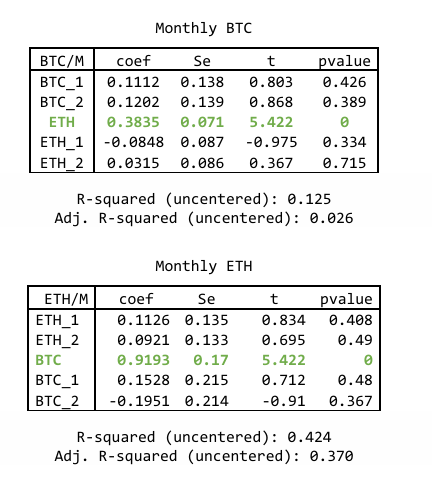
All both timeframe and both cryptos, ETH is the significant positive contribution to BTC and BTC has a significant positive contribution to ETH. These findings imply that both cryptos are moving together. All of them have a 99% level of confidence indicated that they are moving
together significantly both timeframe and asset.
Regression Summary
From 4 of the analysis, we have the summary as followed.
From analysis 1, -Both Timeframe: Dow Jone move together/have positive contribution with BTC/ETH monthly returns. -Only weekly Timeframe: DXY: US dollar index move different path/ have negative
contribution with BTC/ETH weekly returns.
From analysis 2, -Both Timeframe: Principal component 1 2 3 have a positive contribution for BTC/ETH. Note that the PC1 is the most important due to its ability to capture 70% of all stock market index
variance that we included.
-Only Monthly Timeframe: The Principal components PC1 and PC3 negatively contribute to the BTC/ETH and highly significant relationship for PC1 and PC3.
-Only weekly Timeframe: The Principal components PC1, PC2, and PC3 have positive contributions to the BTC/ETH and highly significant relationship for PC1, PC2, and PC3.
Note that the Monthly timeframe gives the conflict result to analysis 1. However, the weekly timeframe gives the same analysis direction as analysis 1. Therefore, we can easily conclude that in the weekly timeframe (Shorter timeframe), the stocks variable provides a positive contribution
to the cryptos returns. The monthly give the conflicting result. Therefore, we cannot conclude the stocks market relationship yet in a more considerable timeframe.
From analysis 3,
-Both timeframes: the DXY: us dollar index, except the monthly ETH, all negatively contribute to the crypto returns.
-Only Weekly: The US bond yield three months have a negative contribution for both Bitcoin: BTC and Ethereum: ETH
The crude oil WTI returns have a positive contribution to the Bitcoin BTC and Ethereum ETH.
-Other Finding: Crypto is not the substitution to the Gold in every timeframe The finding shows the DXY US dollar substitution, and it is consistent with analysis 1.
Note that the substitution is more prevalent in the Weekly timeframe more than the monthly timeframe. The BTC bitcoin show more substitution contribution with DXY than the ETH. However, the substitution is not prevalent with Gold returns, with no significant contribution from Gold to any cryptos and any timeframe. This finding is also consistent with the analysis one that the Gold and cryptos do not show substitution like intuition that people know. The Oil has a positive contribution with Oil in weekly timeframe; any intuition does not support the theory. However, this finding shows that the frequent portfolio allocation should not include
cryptos and Oil into the portfolio together.
From analysis 4,
-Both timeframes, the cryptos are all positive contributions to each other. The ETH is moving in the same direction as BTC. The correlation table also shows that these cryptos are highly correlated. The portfolio should not include ETH and BTC into the portfolio together, or at least should not be both high weights in the portfolio, since, from the correlation table and regression analysis, they have a positive contribution to each other.
Principal Component Analysis
Next step, the research will look at the next steps of Principal component analysis. The main objective is to identify the direction of variance of each asset return variable on the principal component axis. If the direction of spread of the asset is in the same direction, then those assets do not provide colossal diversification benefit. The principal component asset will consist of 4 separate analyses.
- Analysis with deleted outliner on weekly timeframe: since the data with outlier will
deviate the influence of statistic. This approach will delete the most extreme point that
will cause the data to have deviated. - Analysis with deleted outliner on monthly timeframe: deleted outliner with bigger
timeframe. - Analysis with all data points on weekly timeframe: even though the outliner were
prevalent, keeping outliner replicates the natural world that investor that holds particular
asset will face all the return scenarios whether they are outlier or not. - Analysis with all data points on monthly timeframe: included all data points with the
more considerable timeframe.
The principal component analysis is done on both a weekly and monthly timeframe. The variables included in the research will be as followed: Bitcoin [BTC], Ethereum [ETH], USA bond three-month yield [US_3M], US dollar index [DXY], Gold commodity [GOLD], Dowjone
industry index [DOW].
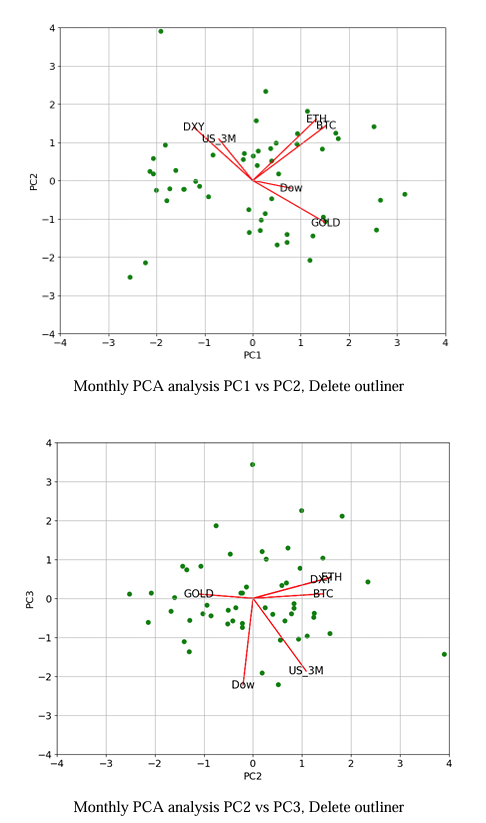
Analysis 1 : Principal component analysis on deleted outliner – Weekly
First, the analysis will take place on the best scenarios of a less extreme outliner. The principal component will take 3 PC axis and plot them respectively by two axes at a time. The analysis asset will include Bitcoin [BTC], Ethereum [ETH], USA bond 3-month yield [US_3M], US dollar index [DXY], Gold commodity [GOLD] , Dowjone industry index [DOW]. By picking
three principal components, the model able to capture approximately 70% of the original variable. The figure below shows the principal component analysis
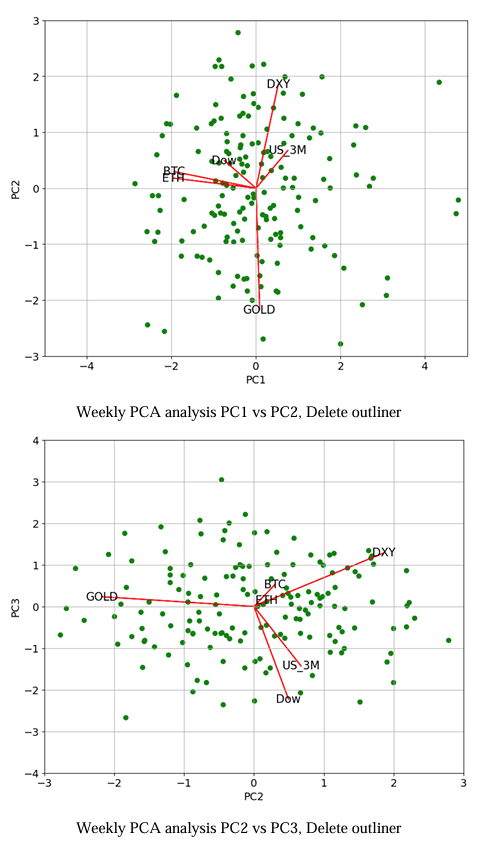
Analysis 1 : Principal component analysis on deleted outliner – Weekly
From the first figure, PC1 vs. PC2, Gold is acting like a hedging asset here with no asset has variance spread like Gold. However, both cryptos BTC and ETH are remarkably close in terms of spread together, and somehow like Dowjone to spread. DXY and US 3 M act like US cash. Therefore, they have their dimension. The analysis of Cryptos is moving together also applied in
this analysis. These crypto have very close spread together in the first 2 PC axis, PC1 and PC2.Gold is the opposite spread of the US dollar, which is true in the theory and practicality of Gold investing. And US3m and DXY are almost in the same direction spread since both considered liquid cash.
2nd Figure PC2 vs. PC3, Both BTC and ETH are also in the same spread direction, and they are remarkably close to each other. What is different? They are the US3_month bond yield and the Dow gone is what different here. In PC1 and PC2, the cryptos and Dow are closed together in the
spread. However, in PC2 and PC3, Dowjone has the opposite direction in the spread. The US_3 month yield does not have a tight spread to the DXY like the PC1 and PC2 graph. 3rd Figure PC1 and PC3, Both BTC and ETH are still moving in the same spread direction. This finding all gives the same result across the 1st, 2nd, and 3rd figures. Therefore, without outlier, in the weekly timeframe, the BTC and ETH are moving together, and results are consistent with the regression analysis. This time The BTC and ETH move in opposite spread comparing to the US 3-month yield. In this figure, Gold and DXY are move opposite to the dow jones. In conclusion, BTC and ETH are mostly moved together, Majority of BTC/ETH moves in the same direction as Dowjone, but there is a minority time when BTC and ETH move in the opposite direction DOWjone. In 3 figures, the BTC/ETH are orthogonal to the GOLD. The BTC/ETH does not have the substitution effect to the gold commodity as everyone claimed. The substitution effect is not prevalent for cryptos and Gold. We will take a more practical way of PCA analysis on non-deleted outlier model, whether they give us the same answer to 1st analysis
or not.
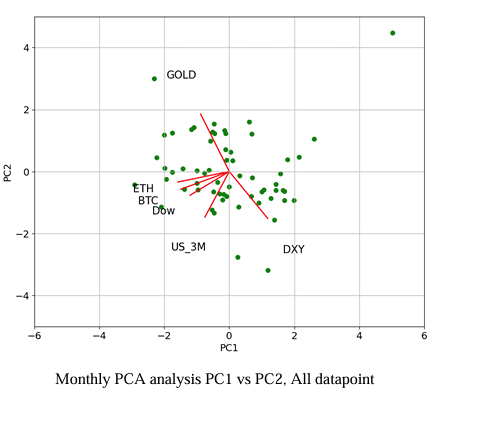
Analysis 2 : Principal component analysis on all data point – Weekly
Second, the analysis will take place more practically with all data points stayed in this model. The principal component will take 3 PC axis and plot them respectively by two axes at a time. The analysis asset will include Bitcoin [BTC], Ethereum [ETH], USA bond three-month yield [US_3M], US dollar index [DXY], Gold commodity [GOLD] , Dowjone industry index [DOW].
By picking three principal components, the model able to capture approximately 70% of the original variable. The figure below shows the principal component analysis.
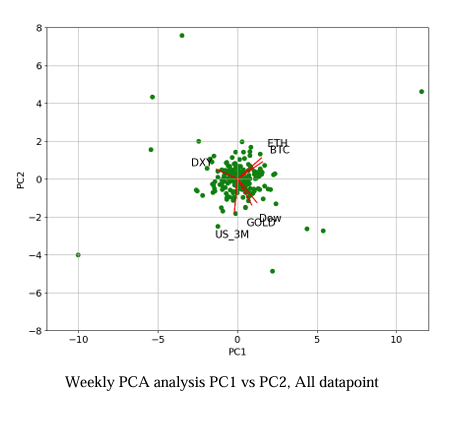
Analysis 2: Principal component analysis on all data point – Weekly description
From the first figure, PC1 and PC2, Ethereum [ETH] and Bitcoin [BTC] spread around the same direction in the major axis. The finding is also consistent with the previous result. However, Dow and Gold are moving in the same spread direction. This finding is not necessarily factual since
the gold price usually moves up with dire economic conditions. However, there are factors such as inflation that drive both dow jones and gold prices up too. Overall, ETH and BTC are not spreading around any other asset direction. Therefore, this behavior of variance represents the
uniqueness of cryptos currency to other assets.2nd Figure PC2 and PC3, Ethereum [ETH] and Bitcoin [BTC] behave the same as PC1 and PC2.
However, the DXY is now around the spread of cryptos. The Cryptos are now spreading in the opposite direction as the DOW, which represents the asset’s substitutes. Gold here is spreading in the opposite direction as BTC/ETH showing the substitution effect between Gold and Crypto
exists but does not exist in the major axis. Therefore, this gold /crypto substitution will not be happening most of the time. 3rd Figure PC1 vs. PC3, Ethereum [ETH] and Bitcoin [BTC] are behave the same as PC1 & PC2, and PC2 & PC3. The analysis concludes the similarity of spreading of BTC and ETH that they are moving together. The result is also consistent with the regression analysis and analysis 1 of principal component analysis. DXY is the opposite of the cryptos, and the result are not the same as the 2nd figure of PC2 vs PC3, in which we have cryptos moving around DXY. This
represents the crypto/cash substation effect axis in a minor axis.
In conclusion: Both of the 3 figures, the cryptos, are spreading together.
Crypto & Dowjone: most of the time, Dow is not spreading the same as the cryptos. More minority of the time, we can see the substitution effect of stock and complement effect when moving together. Crypto & DXY: Figure 1 and Figure 3 show the DXY substitution with Cryptos. Only 2 figures
show that they are moving together. Therefore, most of the time, the DXY and Cryptos are substituted together. Crypto & 3-month yield US Bond: Figure 1, Figure2, Figure3 have an uncorrelated asset to the cryptos. Those are highly effective uncorrelated hedging assets. Crypto & Gold: Figure 1 and Figure 3 show uncorrelation between the gold asset and Cryptos.
Figure 2 shows a direct substitution between gold and cryptos. The underlying theory of gold and cryptos are substituted together is not strong enough, not most of the time.
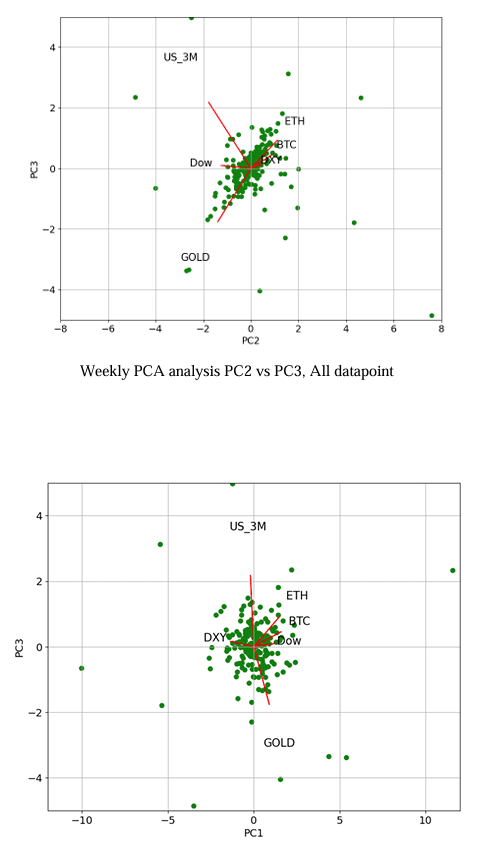
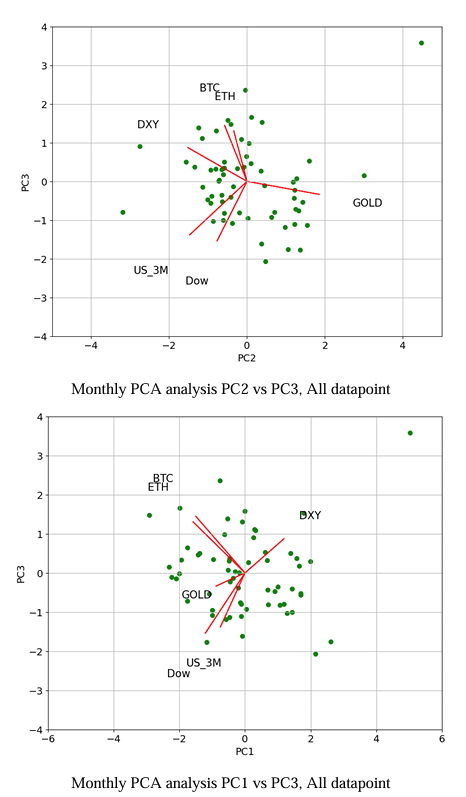
Analysis 3 : Principal component analysis deleted outliner – monthly
Third, the analysis will be conducted on the best scenarios of a less extreme outliner, however, in a more extensive timeframe environment suitable for longer-term investment. The research will take 3 PC axis from principal component analysis and plot them respectively by two axes at a
time. The analysis asset will include Bitcoin [BTC], Ethereum [ETH], USA bond 3-month yield [US_3M], US dollar index [DXY], Gold commodity [GOLD] , Dowjone industry index [DOW]. By picking three principal components, capture approximately 70% of the original variable. The
figure below shows the principal component analysis.
Analysis 3: Principal component analysis deleted outliner – monthly description.
From the first figure, PC1 & PC2, Ethereum [ETH], and Bitcoin [BTC] spread around the same direction in the major axis. The finding is also consistent with the previous result. The Cryptos are uncorrelated with DXY: US Dollar Index, US3 M yield bond, Gold, Dow Jone index. There are two groups between those assets: DXY, and US3_M acts like a cash-like asset; the second is Gold and Dowjone act like investment asset and inflation tolerant asset. 2nd Figure PC2 & PC3, Ethereum [ETH], and Bitcoin [BTC] are behaving the same as PC1 & PC2; in this case, we have DXY moving together as cryptos. Three of them spreading the opposite direction as Gold as a substitution asset. The cryptos in the figure are primarily uncorrelated with Dowjone and US 3-month yield. 3rd Figure PC1 & PC3, Ethereum [ETH] and Bitcoin [BTC] are behave the same as PC1 & PC2, and PC2 & PC3. The Gold here is moving together as cryptos; the substitution effect happens in
the minority axis. And move opposite direction as Gold. The dow/us 3m in a more extensive timeframe is uncorrelated.
In conclusion: Both three figures, the cryptos, are spreading together.
Crypto & Dowjone: Both three figures show almost uncorrelated with stock markets. This finding is not consistent with the weekly timeframe.
Crypto & DXY: Figure 1 show almost uncorrelated effect between cryptos and us dollar index asset. Figure 2 shows that cryptos and DXY are spreading in the same direction. Figure 3 shows the substitution effect of digital currency to real currency. Crypto & 3-month yield US Bond: The 3-month yield bond and cryptocurrency are mostly uncorrelated for all three figures. Crypto & Gold: Figure 1 show nearly uncorrelated effect between cryptos and us gold asset. Figure 2 shows the substitution effect between gold and cryptos currency. Figure 3 shows the same spread direction between cryptos and gold investment.
Analysis 4: Principal component analysis with all data point– monthly
Finally, the analysis will conduct in the practical world. This environment captures all data points into the model. The principal component analysis will pick up to 3 principal components. With each of the two principal components, we plot them in 2 axes, respectively. The research
will include the Bitcoin [BTC], Ethereum [ETH], USA bond 3-month yield [US_3M], US dollar index [DXY], Gold commodity [GOLD] , Dowjone industry index [DOW]. These three principal components will represent approximately 70% of the total variation of the original dataset. The
following figure shows the principal component axis and directional spread of the original variable before dimension reduction, indicated by the line and variable label. We have three figures as followed.
Analysis 4: Principal component analysis all data point – monthly description.
From the first Figure, PC1 & PC2, Ethereum [ETH], and Bitcoin [BTC] are moving/spreading around the same direction in the major axis. This finding is consistent with the result from regression analysis and principal component analysis earlier. The BTC / ETH and Dowjone are almost correlated to each other; this finding is not consistent with delete outliner analysis. The outliner might cause the cryptos and stock market to move together. Us 3M have slightly correlated with the cryptos. The Gold asset and DXY asset are having likely no correlation between the cryptos.
2nd Figure PC2 & PC3, Ethereum [ETH] and Bitcoin [BTC] are also spread in the same direction. All another asset has slightly correlated with the cryptos, Positively by the DXY: us dollar index, Negatively by the Gold and Dowjone index.
3rd Figure PC1 & PC3, Ethereum [ETH] and Bitcoin [BTC] behave the same as PC1 & PC2, and PC2 vs PC3. The gold asset has slightly correlated to Cryptos. Dow/DXY and US 3month likely uncorrelated with BTC/ETH.
In conclusion: In both of the three figures, the cryptos are spreading /moving together in likely similar variance. Crypto & Dowjone: 1st Figure shows that they are spreading around the same direction; figure 2
and figure3 show a slight opposite direction between cryptos and Dowjone.
Crypto & DXY: Figure 1 and Figure 3 show the orthogonal relationship between Cryptos and the
US dollar index. Figure 2 shows the small positive spread between them.
Crypto & 3-month yield US Bond: Figure 1 shows a slight positive spreading relationship, while Figure 2 and Figure 3 show the orthogonal relationship.
Crypto & Gold: Figure 1 show orthogonal, Figure 2 and Figure 3 show slight spread relationship with negative and positive relations, respectively.
SUMMARY PCA Analysis
From 4 principal component analyses, cryptocurrency as an asset has many aspects in them. They are not necessarily correlated with the stocks, not with Gold, cash, and short-term yield bond. All the analyses, both short-term/long-term/ deleted outline/ all datasets, show that the cryptos (Bitcoin and Ethereum) are moving together, and the result is the same with regression analysis. We should not put both bitcoin and Ethereum into the diversified portfolio. The Cryptos interact with Dow Jone (whether it is a substitution effect and complement effect, [Move together or Move Oppositely]) are more prevalent in a shorter timeframe in weekly data.
The monthly data are not presenting that kind of relationship; therefore, these effects mostly come from the psychological factor of swing trading rather than value investing. The Cryptos interact with DXY: US Dollar index 3 out of 4 of the analysis shows that the Us Dollar index has different interactions with the Bitcoin and Ethereum. The effect is following No
interaction, Substitution, Complement, respectively. Most of the time, the Bitcoin and US dollar index are orthogonal together. The minor majority of the time, there will be substitution where the Bitcoin and Ethereum are moving /spreading oppositely, and the minor majority of the time
will be complementing effect where Bitcoin and Ethereum are moving /spreading together. Therefore, there is no clear-cut relationship between these assets.
The Cryptos interaction with 3-month yield, the analysis across timeframe, presents that most of the time, the 3-month yield bond in US and Bitcoin/Ethereum is not moving together and give orthogonal effect. Therefore the 3 -month us yield bonds are primarily uncorrelated with Cryptos and behave like uncorrelated hedging assets of cryptocurrency.
The Cryptos interaction with Gold, the analysis across timeframe indicates that Gold price having different interaction with the Bitcoin and Ethereum. The effect is following No interaction, Complement, substitution, respectively. Most of the time, the Bitcoin Gold return is orthogonal together, then less of the time there will be Complement where the Bitcoin and Ethereum are moving /spreading together, and less of the time will be substitution effect where Bitcoin and Ethereum are moving /spreading oppositely. Therefore, there is no clear-cut relationship between these assets.
Therefore, we have shown the role of cryptocurrency in the diversified portfolio. They act like an additional asset that proved to have a different place in the portfolio and present that they are not entirely correlated with another asset. Larger timeframes show less correlation between the
cryptos and another asset. Therefore, as the more extended investment horizon portfolio, the cryptocurrency acts better in terms of the diversified asset. Finally, as bitcoin and Ethereum are considered cryptocurrencies together, the investor should not put into the same portfolio since
they tend to move together even though their functionality might not be the same.
SUMMARY ANALYSIS
From the regression analysis/ Principal component analysis, we will separate the interaction into each asset.
Cryptocurrency & Cryptocurrency: Both regression analysis and Principal component analysis indicate that they are moving together. They are not present the diversified asset when combining them, and thus, an investor should not put these assets into the same portfolio. Although they have different functionality between Bitcoin and Ethereum, the investor perceives that they are moving together, and thus it is dangerous to put a similar asset into the portfolio. Cryptocurrency & stock market: The regression analysis yields the result that Dowjone and 2
Cryptocurrency are moving together across a timeframe. However, in Principal component analysis, the stock market does not have the prevalent interaction in the larger timeframe. Therefore, It very safe to assume the interaction between Cryptocurrency and psychological
effect with the stock market movement in a short timeframe. Cryptocurrency & US dollar index: For regression analysis, we have the result that DXY is moving oppositely to the Cryptocurrency, more prevalent in the weekly timeframe, while the Principal component analysis shows that the DXY mostly are orthogonal with the Cryptocurrency. Therefore, we got a mixed conclusion here, representing that the relationship between this asset might not be linearly correlated, and more research needs investigation. Cryptocurrency & Alternative Asset: For regression analysis, the Gold price return does not contribute to the cryptocurrency return and principal component analysis, in the major axis, also shows that gold and Cryptocurrency are orthogonal together. Therefore, gold is the uncorrelated hedging asset for the portfolio with crypto and does not act like a substituted asset.
For the 3-month US bond, both analyses present that they are likely not correlated to each other. For the oil, they have a positive contribution to the cryptocurrency return. Therefore it is recommended that we should not put the crude oil, oil producing company into the portfolio when we construct
the portfolio with weekly allocation and have Cryptocurrency [BTC| ETH] in it.
Cryptocurrency derivative opportunity
From the analysis, we have shown that cryptocurrency acts as an additional asset to the field. Therefore, the role of cryptocurrency derivative will not stack with another asset derivative. The part of each cryptocurrency derivative asset is as followed. Cryptocurrency Future: the future provides the way to speculate the cryptocurrency returns. The cryptos are very volatile, and adding leverage from the future derivative will make the
cryptocurrency derivative such as Bitcoin future and Ethereum Future being one of the most speculative investment out of all asset derivative. The volatility present by cryptocurrency has the potential to make the trade wealthy with little cash required. In addition, cryptocurrency hedging can be done by short the future as well. Since the cryptocurrency has no clear-cut movement interaction to another asset, the long and short direction will not wholly overlap with the long and short of another asset. Nonoverlapping is the idea asset to put into portfolio since
what investor needs to most from portfolio optimization is diversifying it. In addition, for people that initially invest in cryptocurrency, adding the future and help them hedge some of the time when the cryptocurrency market does not look promising. Therefore, the futures will increase the
confidence of people who is generally invest in the cryptocurrency and prevent some unnecessary volatility/drawdown period. Cryptocurrency options: The options will present the cryptocurrency more angle of investment. Due to the volatility of Bitcoin and Ethereum, the options are more promising since it limits the volatility. In addition, the strategy created by options is much more applicable to the bitcoin/Ethereum than the stocks because of volatility reason alone. The options will add additional hedging/diversification power to the portfolio. Since the asset is not behaving like another asset, the cryptocurrency option will not be stacked with other derivative investments such as stock option, yield option, and gold option.
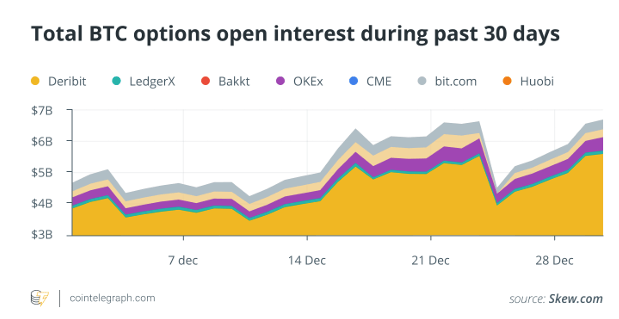
DERIVATIVE MARKET
As cryptocurrencies become more popular, their derivative will continuously originate. There is rising in the cryptocurrency derivatives market. The majority of the cryptocurrency asset is bitcoin derivative, Ethereum derivative. The figure below represented the Bitcoin option open
interest growth by each market in December 2020
In addition to Bitcoin future/derivative there are still many cryptocurrencies related product
listed below, followed by most traded platform
1. Bitcoin Future : Okex . Huobi , Binance, Deribit , Bitmex , Bybit , Ftx , Btse , Kraken
2. Ethereum Future : Houbi , Binance , Okex , Ftx , Bitmex , Acdx
3. Binance Coin Future : Binance , Ftx
4. Xrp Future : Bitmex , Ftx , Houbi, Binance , Okex ,Kraken
5. Tether Future : Ftx
6. Cardano Future : Bitmex , Binance , Ftx , Houbi, Okex
7. Dogecoin Future : Ftx
8. Polkadot Future : Houbi, Binance , Okex , Ftx
9. Uniswap Future: Ftx
10. Litecoin Future : Houbi, Okex, Binance, Houbi , Bitmex , Okex , Ftx , Btse , Kraken
11. Bitcoin Cash Future: Houbi, Okex , Binance , Bitmex , Kraken ,Coinflex
12. Chainlink Future : Bitmex , Ftx, Binance , Houbi , Okex , Coinflex
13. Solana Future : Ftx
14. Theta Network : Ftx
15. Filecoin : Houbi , Ftx , Okex
16. Tron : Ftx , Houbi , Okex
17. Monero Future : Btse
18. Eos Future : Bitmex , Houbi , Okex , Ftx
19. Cosmos Future : Ftx
20. Aave Future : Ftx
Source: https://www.coingecko.com/en/derivatives/futures
As we can see, in the cryptocurrency market, there are many popular platforms such as Okex, Huobi, Binance, and some have many cryptocurrency derivatives there Ftx, Base. Therefore, there are many platforms that investors can place the derivative investment on, and they can further create a more diversified portfolio.
CONCLUSION
In the research, we have shown the role of cryptocurrency in diversified portfolios, how the two major cryptocurrencies, Bitcoin and Ethereum, interact with another investing asset. Since the crypto does have its place comparing to another asset, their derivative should enhance the diversification of the portfolio. And finally, many platforms have crypto derivatives such as FTX, Binance Future, and investors with access to a diversified portfolio. The technological period always changing, the result concluded from this paper might be different into the future, the practitioner must continuously come up with new analysis and prepare for the technological adaptation.
Reference
(Hongwei Zhang, Peijin Wang, 2021) Does Bitcoin or gold react to financial stress alike?
Evidence from the U.S. and China 71, 629-648
(Syed Jawad, Hussain Shahzad , Elie Bouri , David Roubaud , Ladislav Kristoufek , Brian
Lucey, 2019) Is Bitcoin a better safe-haven investment than gold and commodities? 322-300
(Erdinc Akyildirim, Shaen Corbet , Paraskevi Katsiampa , Neil Kellardf, Ahmet Sensoy, 2020)
The development of Bitcoin futures: Exploring the interactions between cryptocurrency
derivatives 101-234
(Dehouche, 2021) Scale matters: The daily, weekly and monthly volatility and predictability of
Bitcoin, Gold, and the S&P 500 21
(Elie Bouri , Syed Jawad Hussain Shahzad, David Roubaud, Ladislav Kristoufek, Brian Lucey ,
2020) Bitcoin, gold, and commodities as safe havens for stocks: New insight through wavelet
analysis 156-164
(Zhiyong Cheng , Jun Deng , Tianyi Wang , Mei Yu, 2021) Liquidation, Leverage and Optimal
Margin in Bitcoin Futures Markets 2012
(Merwe, 2021) A Taxonomy of Cryptocurrencies and Other Digital Assets 30 -43
(Yang Hu, Yang Greg Hou, Les Oxley, 2020) What role do futures markets play in Bitcoin
pricing? Causality, cointegration and price discovery from a time-varying perspective? 101-569
(Carol Alexander, Jaehyuk Choi, Heungju Park, Sungbin Sohn , 2019) BitMEX bitcoin
derivatives: Price discovery, informational efficiency, and hedging effectiveness 518-550


Leave a comment